Dynamic QR codes with analytics have revolutionized digital marketing, with 79% of businesses using them for personalized customer interactions and 433% increase in scans since 2021. Unlike static codes, they can be updated anytime and provide detailed tracking data.
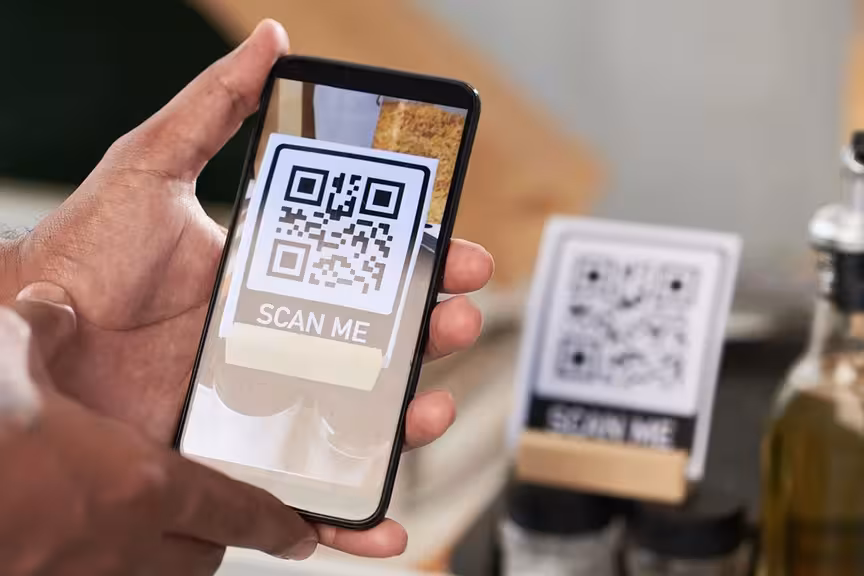
Imagine creating a QR code for your marketing campaign, printing it on thousands of flyers, then realizing you need to change the website it points to. With regular QR codes, you'd have to reprint everything. With dynamic QR codes, you just update the destination online in seconds.
That's the power of dynamic QR codes. They're not just scannable links, they're smart marketing tools that adapt, track, and provide insights that can transform your business results. Let's explore how to create and use them effectively.
Quick Answer: What Are Dynamic QR Codes?
Dynamic QR codes use a short URL that redirects to your content, allowing you to update destinations without changing the printed code. They provide detailed analytics on scans, user behavior, and campaign performance.
- Why 79% of businesses choose dynamic QR codes over static ones
- Step-by-step guide to creating dynamic QR codes with analytics
- How to track 433% more engagement with proper analytics setup
- Advanced metrics that 95% of businesses use for first-party data
- Real optimization strategies that improve campaign ROI by 30%
- Common tracking mistakes that waste marketing budgets
Ready to Create Your QR Code?
Join thousands of users who trust our platform for their QR Code needs. Start generating professional QR-Codes in seconds!
Dynamic QR Codes vs Static QR Codes: Why It Matters
Understanding the difference between dynamic and static QR codes is crucial for anyone serious about QR code marketing:
Static QR codes store information directly in the black and white pattern. Once created, they're permanent. You can't change where they lead or track who scans them. Think of them like printed business cards.
Dynamic QR codes contain a short URL that redirects to your actual content. You can update this destination anytime, and every scan is tracked with detailed analytics. They work like smart redirects.
The numbers speak for themselves: 79% of businesses use dynamic QR codes for personalized interactions, and dynamic QR code scans have increased 433% since 2021. The dynamic QR code market is growing because businesses need flexibility and data.
Here's what makes dynamic QR codes so powerful:
Update anytime: Change destinations without reprinting codes. Perfect for evolving campaigns, seasonal promotions, or fixing mistakes.
Track everything: See when, where, and how people scan your codes. Get insights into user behavior and campaign performance.
Personalize experiences: Show different content based on location, device, or time of scan.
A/B test easily: Test different landing pages or offers without creating new QR codes.
Measure ROI: Connect scans to conversions and revenue for real business impact measurement.
Step-by-Step: How to Create Dynamic QR Codes with Analytics
Step 1: Choose a Dynamic QR Code Generator
Not all QR code generators offer analytics. You need a platform that provides dynamic QR codes with tracking capabilities. Look for features like real-time analytics, geographic tracking, device detection, and integration with tools like Google Analytics.
Popular options include QR Tiger, Uniqode, Scanova, and our own QR Code Generator with advanced analytics features.
Step 2: Set Up Your Tracking Parameters
Before creating your QR code, decide what you want to track:
Campaign goals: App downloads, website visits, sales, email signups?
Target metrics: Total scans, unique users, conversion rates, geographic distribution?
Time frame: How long will you run this campaign?
Success criteria: What numbers will indicate success?
Step 3: Create Your Dynamic QR Code
Here's the typical process for most platforms:
1. Select QR code type: Choose URL, file, contact card, or other content type
2. Enter destination: Add your website URL, file, or information
3. Enable analytics: Make sure tracking is activated (usually automatic with dynamic codes)
4. Customize design: Add your logo, colors, and branding
5. Name your campaign: Use descriptive names for easy tracking
6. Generate and test: Create the code and test scanning on different devices
Step 4: Set Up Advanced Analytics
For deeper insights, integrate your dynamic QR codes with Google Analytics:
Add UTM parameters: Include campaign source, medium, and name in your URLs
Set up goals: Define what actions count as conversions
Configure events: Track specific interactions like downloads or form submissions
Create custom reports: Build dashboards that show QR code performance alongside other marketing metrics
Step 5: Deploy and Monitor
Place your QR codes strategically and start monitoring immediately:
Test placement: Different locations may produce different results
Monitor real-time: Watch scans as they happen to catch issues early
Track user journey: See what people do after scanning
Optimize continuously: Use data to improve campaigns
Essential QR Code Analytics Metrics to Track
Basic Metrics (Track These First)
Total Scans: How many times your QR code was scanned overall. This is your primary engagement metric.
Unique Scans: How many different people scanned your code. This shows your actual reach, not just engagement intensity.
Scan Rate: Percentage of people who see your QR code and actually scan it. Industry average is 15%, but good campaigns achieve 25-30%.
Peak Scanning Times: When people scan most frequently. Use this to optimize campaign timing and content updates.
Advanced Metrics (For Campaign Optimization)
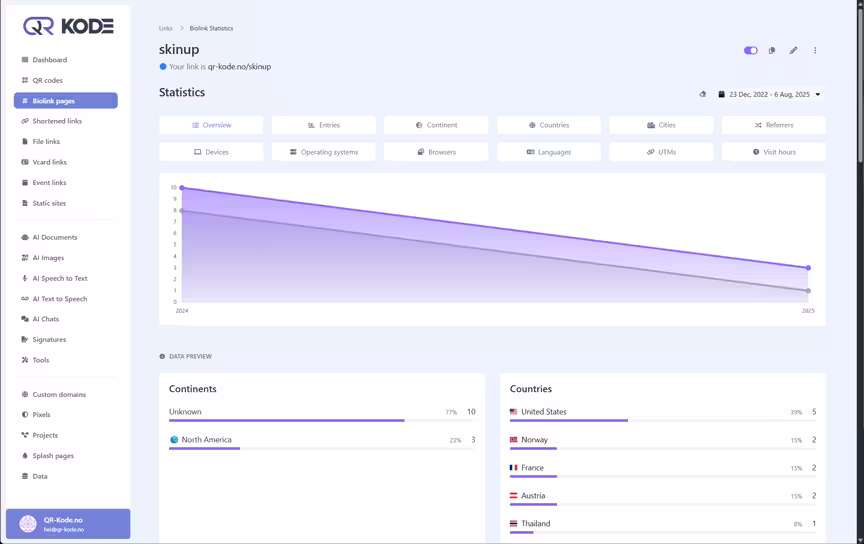
Geographic Data: Where your scans come from. 69% of marketers update destinations monthly based on location data.
Device Information: iOS vs Android, mobile vs desktop. Optimize landing pages for the most common devices.
Conversion Tracking: How many scans lead to desired actions. This connects QR codes to actual business results.
User Journey Analysis: What people do after scanning. Only 31% of businesses track this, but it's crucial for optimization.
Return Visit Rate: How many people scan your codes multiple times. Indicates ongoing engagement and content value.
Business Impact Metrics
Revenue Attribution: Sales directly connected to QR code scans. Essential for ROI calculation.
Cost Per Scan: Campaign cost divided by total scans. Helps compare efficiency across different campaigns.
Customer Acquisition Cost: How much you spend to acquire customers through QR codes versus other channels.
Lifetime Value Impact: Long-term value of customers acquired through QR code campaigns.
Real Business Success Stories with Dynamic QR Code Analytics
Restaurant Chain Optimization
A restaurant chain used dynamic QR codes for digital menus and tracked customer behavior. Analytics revealed that 68% of scans happened during dinner hours, and customers who scanned spent 15% more on average. They optimized menu placement and saw 22% increase in upselling success.
Retail Product Launch
An e-commerce company put dynamic QR codes on product packaging linking to exclusive content. Analytics showed 57% of customers scanned for additional product information, with peak activity on weekends. They adjusted their content strategy and saw 30% improvement in customer engagement.
Event Marketing Campaign
An event organizer used dynamic QR codes on promotional materials. Real-time analytics showed 47% of scans came from mobile devices during commute hours. They optimized mobile landing pages and increased registration rates by 35%.
Print Advertising Success
A magazine ad campaign with dynamic QR codes tracked geographic performance. Analytics revealed higher engagement in urban areas, leading to targeted follow-up campaigns that improved ROI by 28%.
Advanced QR Code Analytics Strategies
Geographic Targeting
Use location data to personalize experiences. If analytics show high scanning activity in specific cities, create location-specific content or promotions for those areas.
Time-Based Optimization
Analyze peak scanning times to schedule content updates, promotional launches, or special offers when your audience is most active.
Device-Specific Content
If 80% of your scans come from mobile devices, ensure your landing pages are mobile-optimized and consider mobile-specific features like click-to-call buttons.
A/B Testing Different Destinations
Test different landing pages using the same QR code. Change destinations weekly and compare conversion rates to find the most effective content.
Integration with Marketing Tools
Connect QR code analytics with Google Analytics, CRM systems, and email marketing platforms for complete customer journey tracking.
Common QR Code Analytics Mistakes
Mistake 1: Only tracking basic metrics.
Don't just count scans. Track conversions, user behavior, and business impact to understand real performance.
Mistake 2: Ignoring the post-scan journey.
87% of marketers struggle with this. Set up conversion tracking to see what happens after people scan.
Mistake 3: Not using UTM parameters.
Add UTM codes to your URLs for better tracking in Google Analytics and clearer campaign attribution.
Mistake 4: Failing to act on data.
69% of marketers update QR destinations monthly. Use your analytics to optimize campaigns, don't just collect data.
Mistake 5: Poor campaign organization.
Use clear naming conventions and campaign tags so you can compare performance across different QR code campaigns.
Mistake 6: Not setting up alerts.
Configure notifications for unusual activity, high scan volumes, or conversion milestones to respond quickly to opportunities.
Optimizing QR Code Performance with Analytics Data
Improve Scan Rates
If your scan rate is below 15%, consider:
• Better QR code placement (eye level, good lighting)
• Clearer call-to-action text
• More compelling value proposition
• Larger QR code size for easier scanning
Boost Conversion Rates
Use analytics to identify drop-off points:
• Slow-loading landing pages (optimize for mobile)
• Confusing user experience (simplify navigation)
• Unclear next steps (add prominent call-to-action buttons)
• Poor mobile optimization (ensure responsive design)
Maximize Engagement
Analytics reveal engagement patterns:
• Peak scanning times (schedule content updates accordingly)
• Popular content types (create more of what works)
• User return rates (improve content to encourage repeat visits)
• Geographic preferences (localize content for different regions)
Setting Up Google Analytics for QR Code Tracking
Why Google Analytics Matters
While QR code generators provide basic analytics, Google Analytics offers deeper insights into user behavior after scanning. Only 31% of businesses track the post-scan journey, missing valuable optimization opportunities.
UTM Parameter Setup
Add these parameters to your QR code URLs:
utm_source: Where the QR code appears (poster, product_package, flyer)
utm_medium: Always use "qrcode" for QR code campaigns
utm_campaign: Specific campaign name (summer_sale_2025, product_launch)
utm_content: Specific placement or variation (lobby_poster, table_tent)
Google Analytics 4 Configuration
1. Set up conversion goals for QR code traffic
2. Create custom events for QR code scans
3. Build reports specifically for QR code campaigns
4. Configure alerts for significant changes in QR code traffic
Advanced Analytics Features to Look For
Real-Time Tracking
See scans as they happen. This helps you respond quickly to viral content, identify issues immediately, and capitalize on trending topics or events.
Heatmap Integration
Some advanced platforms show geographic heatmaps of scanning activity, helping you visualize where your campaigns perform best.
Device and Browser Analytics
Understanding that 89 million Americans scanned QR codes in 2023, mostly on smartphones, helps optimize the experience for the right devices.
Cohort Analysis
Track groups of users over time to understand long-term engagement patterns and customer lifecycle behavior.
Revenue Attribution
Connect QR code scans directly to sales data to calculate true ROI and justify marketing spend.
QR Code Analytics Best Practices
Start with clear goals. Define what success looks like before launching campaigns. Are you measuring awareness, engagement, or sales?
Use descriptive naming. Name your QR codes and campaigns clearly so you can easily analyze performance later.
Set up tracking from day one. Don't add analytics as an afterthought. Plan your tracking strategy before creating codes.
Regular monitoring schedule. Check analytics weekly, not just at campaign end. 69% of marketers update destinations monthly based on performance data.
Cross-reference with other data. Combine QR code analytics with sales data, website analytics, and customer feedback for complete insights.
Act on insights quickly. Use the flexibility of dynamic QR codes to optimize campaigns in real-time based on analytics data.
Future of Dynamic QR Codes and Analytics
QR code analytics are becoming increasingly sophisticated:
AI-powered insights: Artificial intelligence will predict optimal QR code placement, timing, and content based on historical performance data.
Predictive analytics: Systems will suggest the best times and locations to deploy QR codes based on past campaign data.
Advanced personalization: QR codes will deliver different content based on user history, preferences, and behavior patterns.
Enhanced security tracking: Better monitoring for fraudulent scans and tampered QR codes to protect brand reputation.
Cross-platform integration: Seamless data flow between QR code analytics and all your marketing tools for unified customer insights.
With the dynamic QR code market growing 17.2% annually and expected to reach $15.9 billion by 2030, these analytics capabilities will become standard business tools.
Frequently Asked Questions
What's the difference between dynamic and static QR code analytics?
Static QR codes provide no analytics at all. Dynamic QR codes track everything: scans, locations, devices, times, and user behavior. Only dynamic codes offer the data businesses need for optimization.
How much do dynamic QR codes with analytics cost?
Basic plans start around $10-25/month for small businesses. Professional analytics typically cost $25-75/month. Enterprise solutions with advanced tracking can cost $100-500+/month.
Can I track ROI from QR code campaigns?
Yes, by connecting QR code analytics with sales data and conversion tracking. Businesses report 30% higher engagement rates when using tracked QR codes versus untracked ones.
What metrics are most important for QR code success?
Focus on scan rate (engagement), conversion rate (effectiveness), and return visits (content quality). Advanced businesses also track geographic distribution and device types for optimization.
How often should I check QR code analytics?
Check weekly for active campaigns, monthly for ongoing codes. 69% of marketers update QR destinations monthly based on performance data. Set up alerts for significant changes.
Can I use Google Analytics with QR codes?
Yes, add UTM parameters to your QR code URLs for detailed tracking in Google Analytics. This provides deeper insights into user behavior after scanning.
What's a good scan rate for QR codes?
Industry average is 15%, good campaigns achieve 25-30%, and excellent campaigns can reach 40%+. Your rate depends on placement, value proposition, and target audience.
Bottom Line
Dynamic QR codes with analytics aren't just upgraded QR codes, they're smart marketing tools that provide the flexibility and insights modern businesses need. With 79% of businesses using them for personalized interactions and scan rates growing 433% since 2021, the data is clear: dynamic codes with analytics deliver results.
The key to success lies in proper setup, consistent monitoring, and acting on the insights you gather. Start with clear goals, choose the right tracking metrics, and use the data to continuously optimize your campaigns.
Remember: 87% of marketers struggle to understand the customer journey after scanning. By implementing proper analytics tracking, you'll be in the 13% who truly understand and optimize their QR code performance.
Ready to create dynamic QR codes with powerful analytics? Start with our professional QR Code Generator that provides comprehensive tracking, real-time insights, and optimization tools to maximize your campaign success.

Thomas Alling
Thomas is a digital marketing expert and CEO of Mementor with over 25 years of experience in web design, programming, and digital marketing. He specializes in helping businesses implement QR code strategies that bridge physical and digital experiences across multiple industries.
View all posts by Thomas Alling